In marketing, scaling campaigns can lead to a plateau in performance due to the law of diminishing returns.
Made with Supademo
Create step-by-step product demos and tutorials for your company for free. No credit card required.
Scaling Dashboard
Denis Capko
Updated: May 29, 2025
Description
Click through a step-by-step, interactive demo walkthrough of Google, powered by Supademo.
Steps
1
In marketing, scaling campaigns can lead to a plateau in performance due to the law of diminishing returns.
2
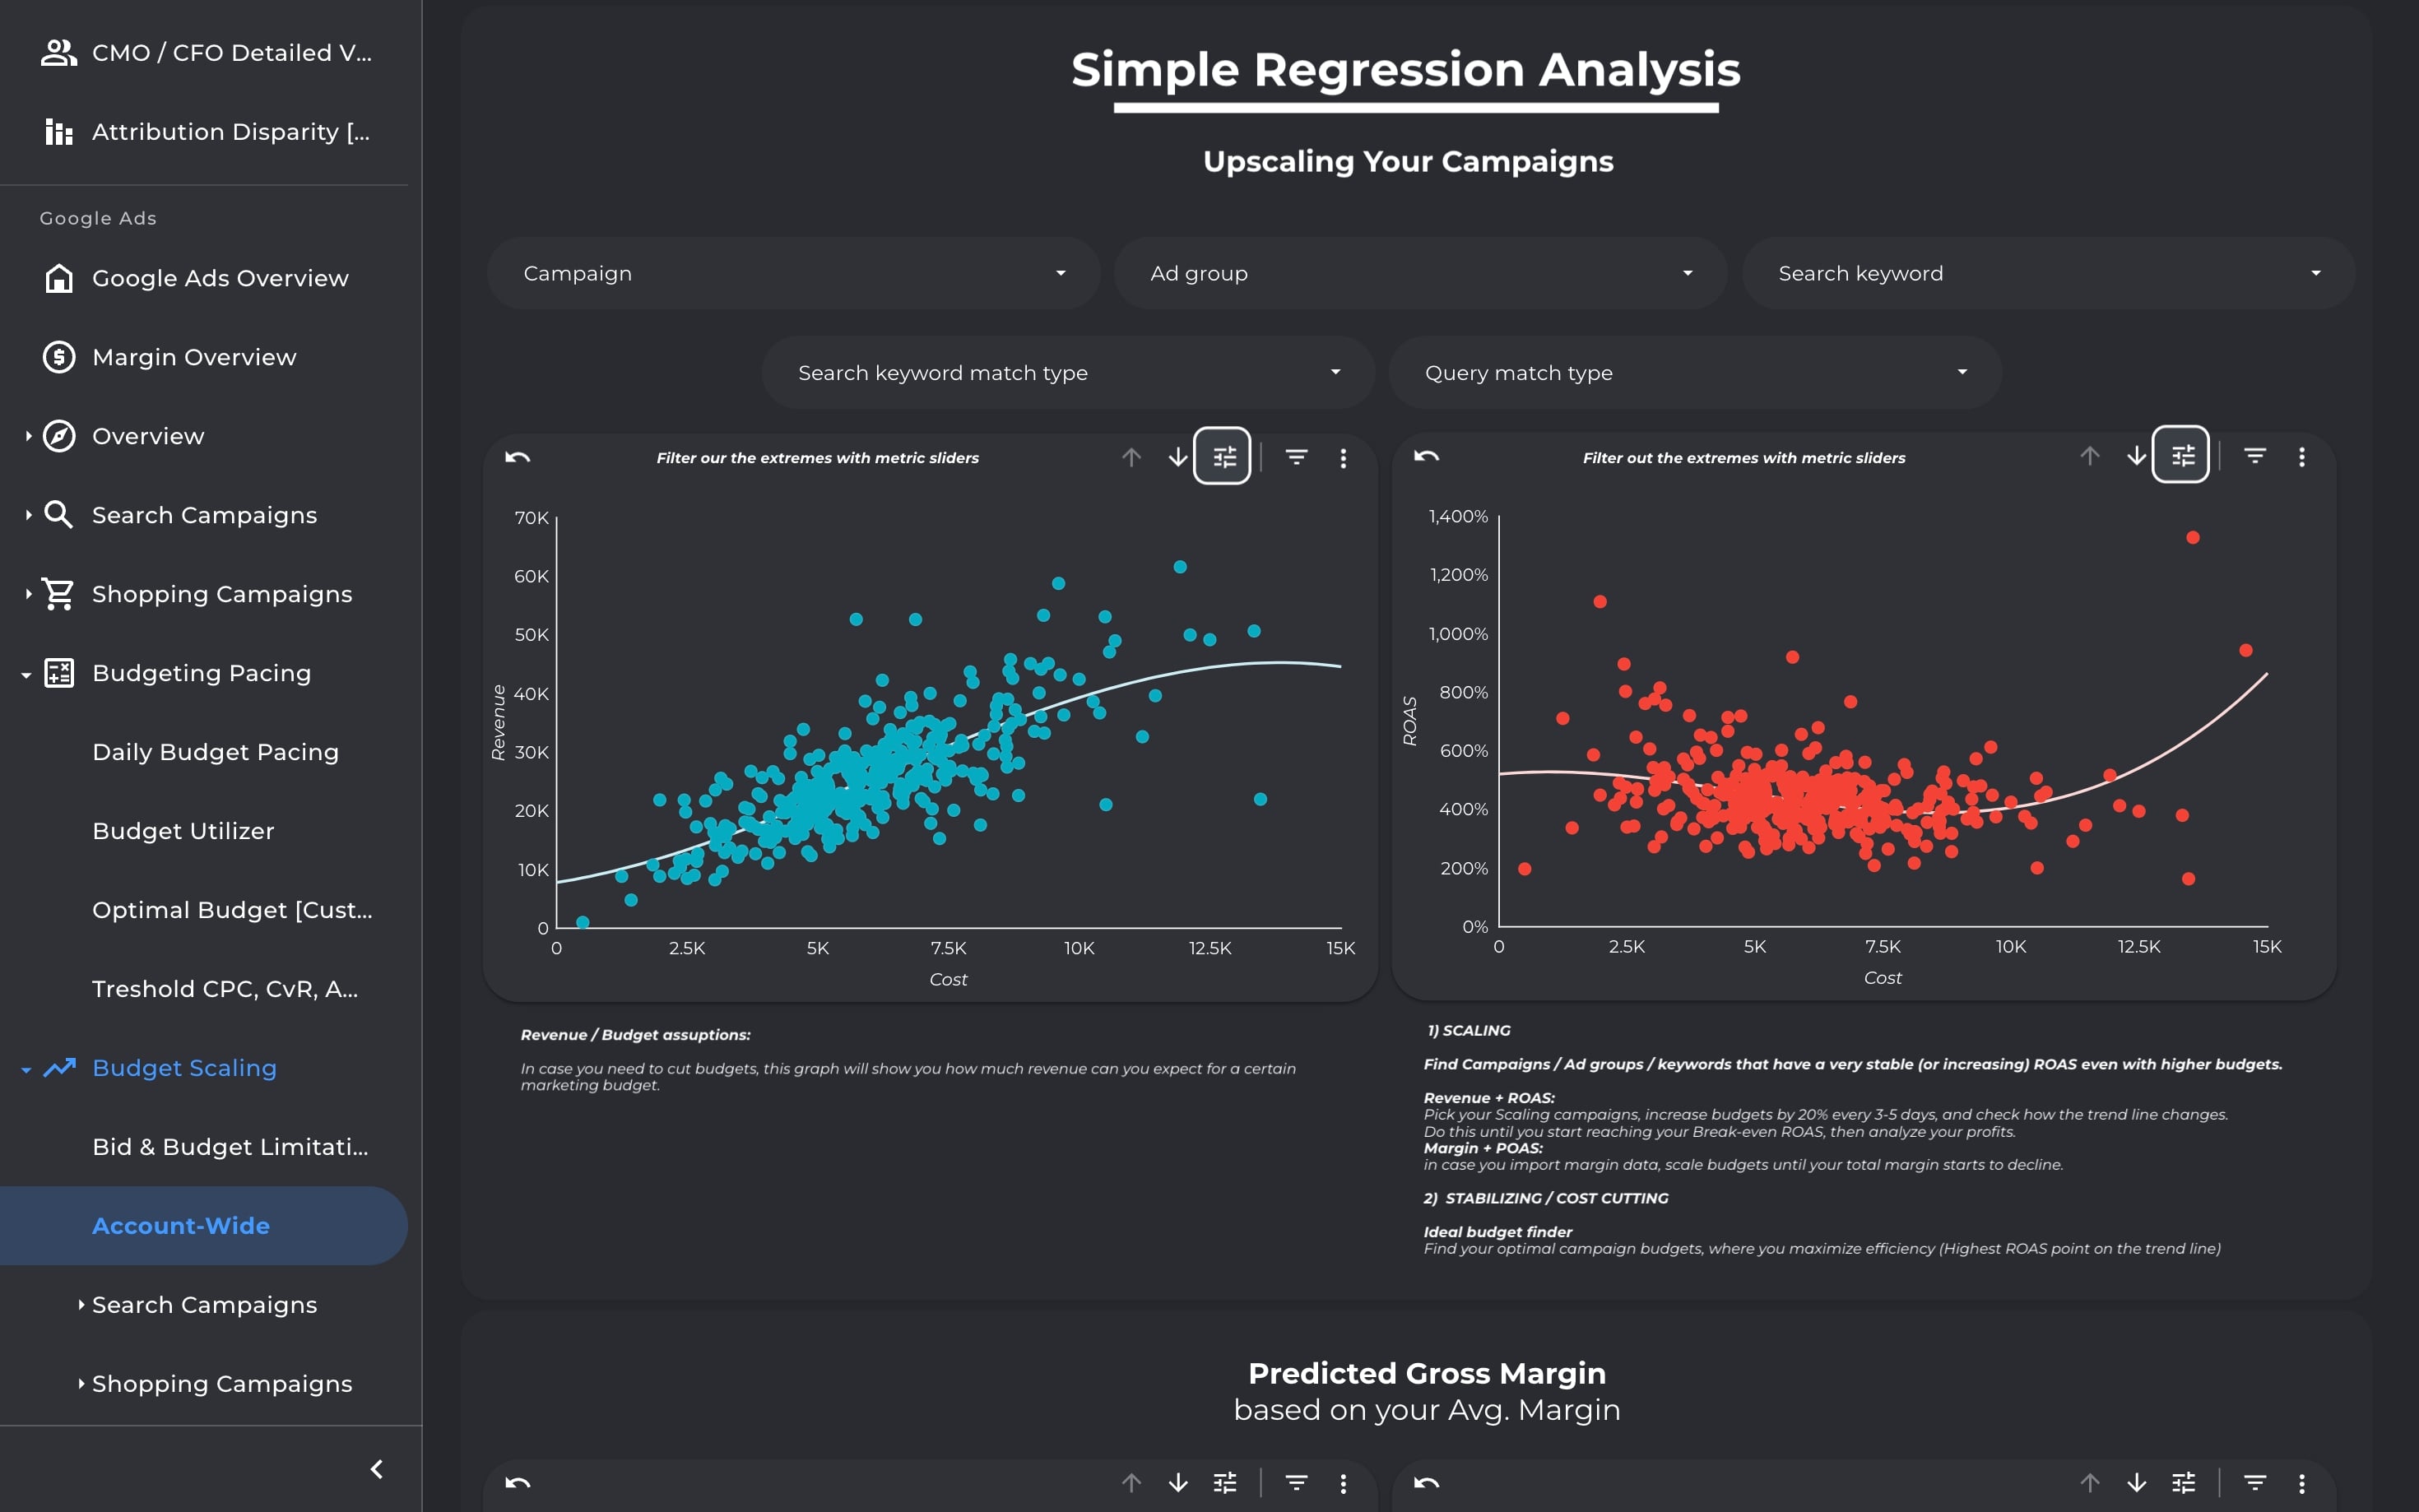
Firstly, these Simple Regressions will help you better understand how your performance declines with an increased budget.
3
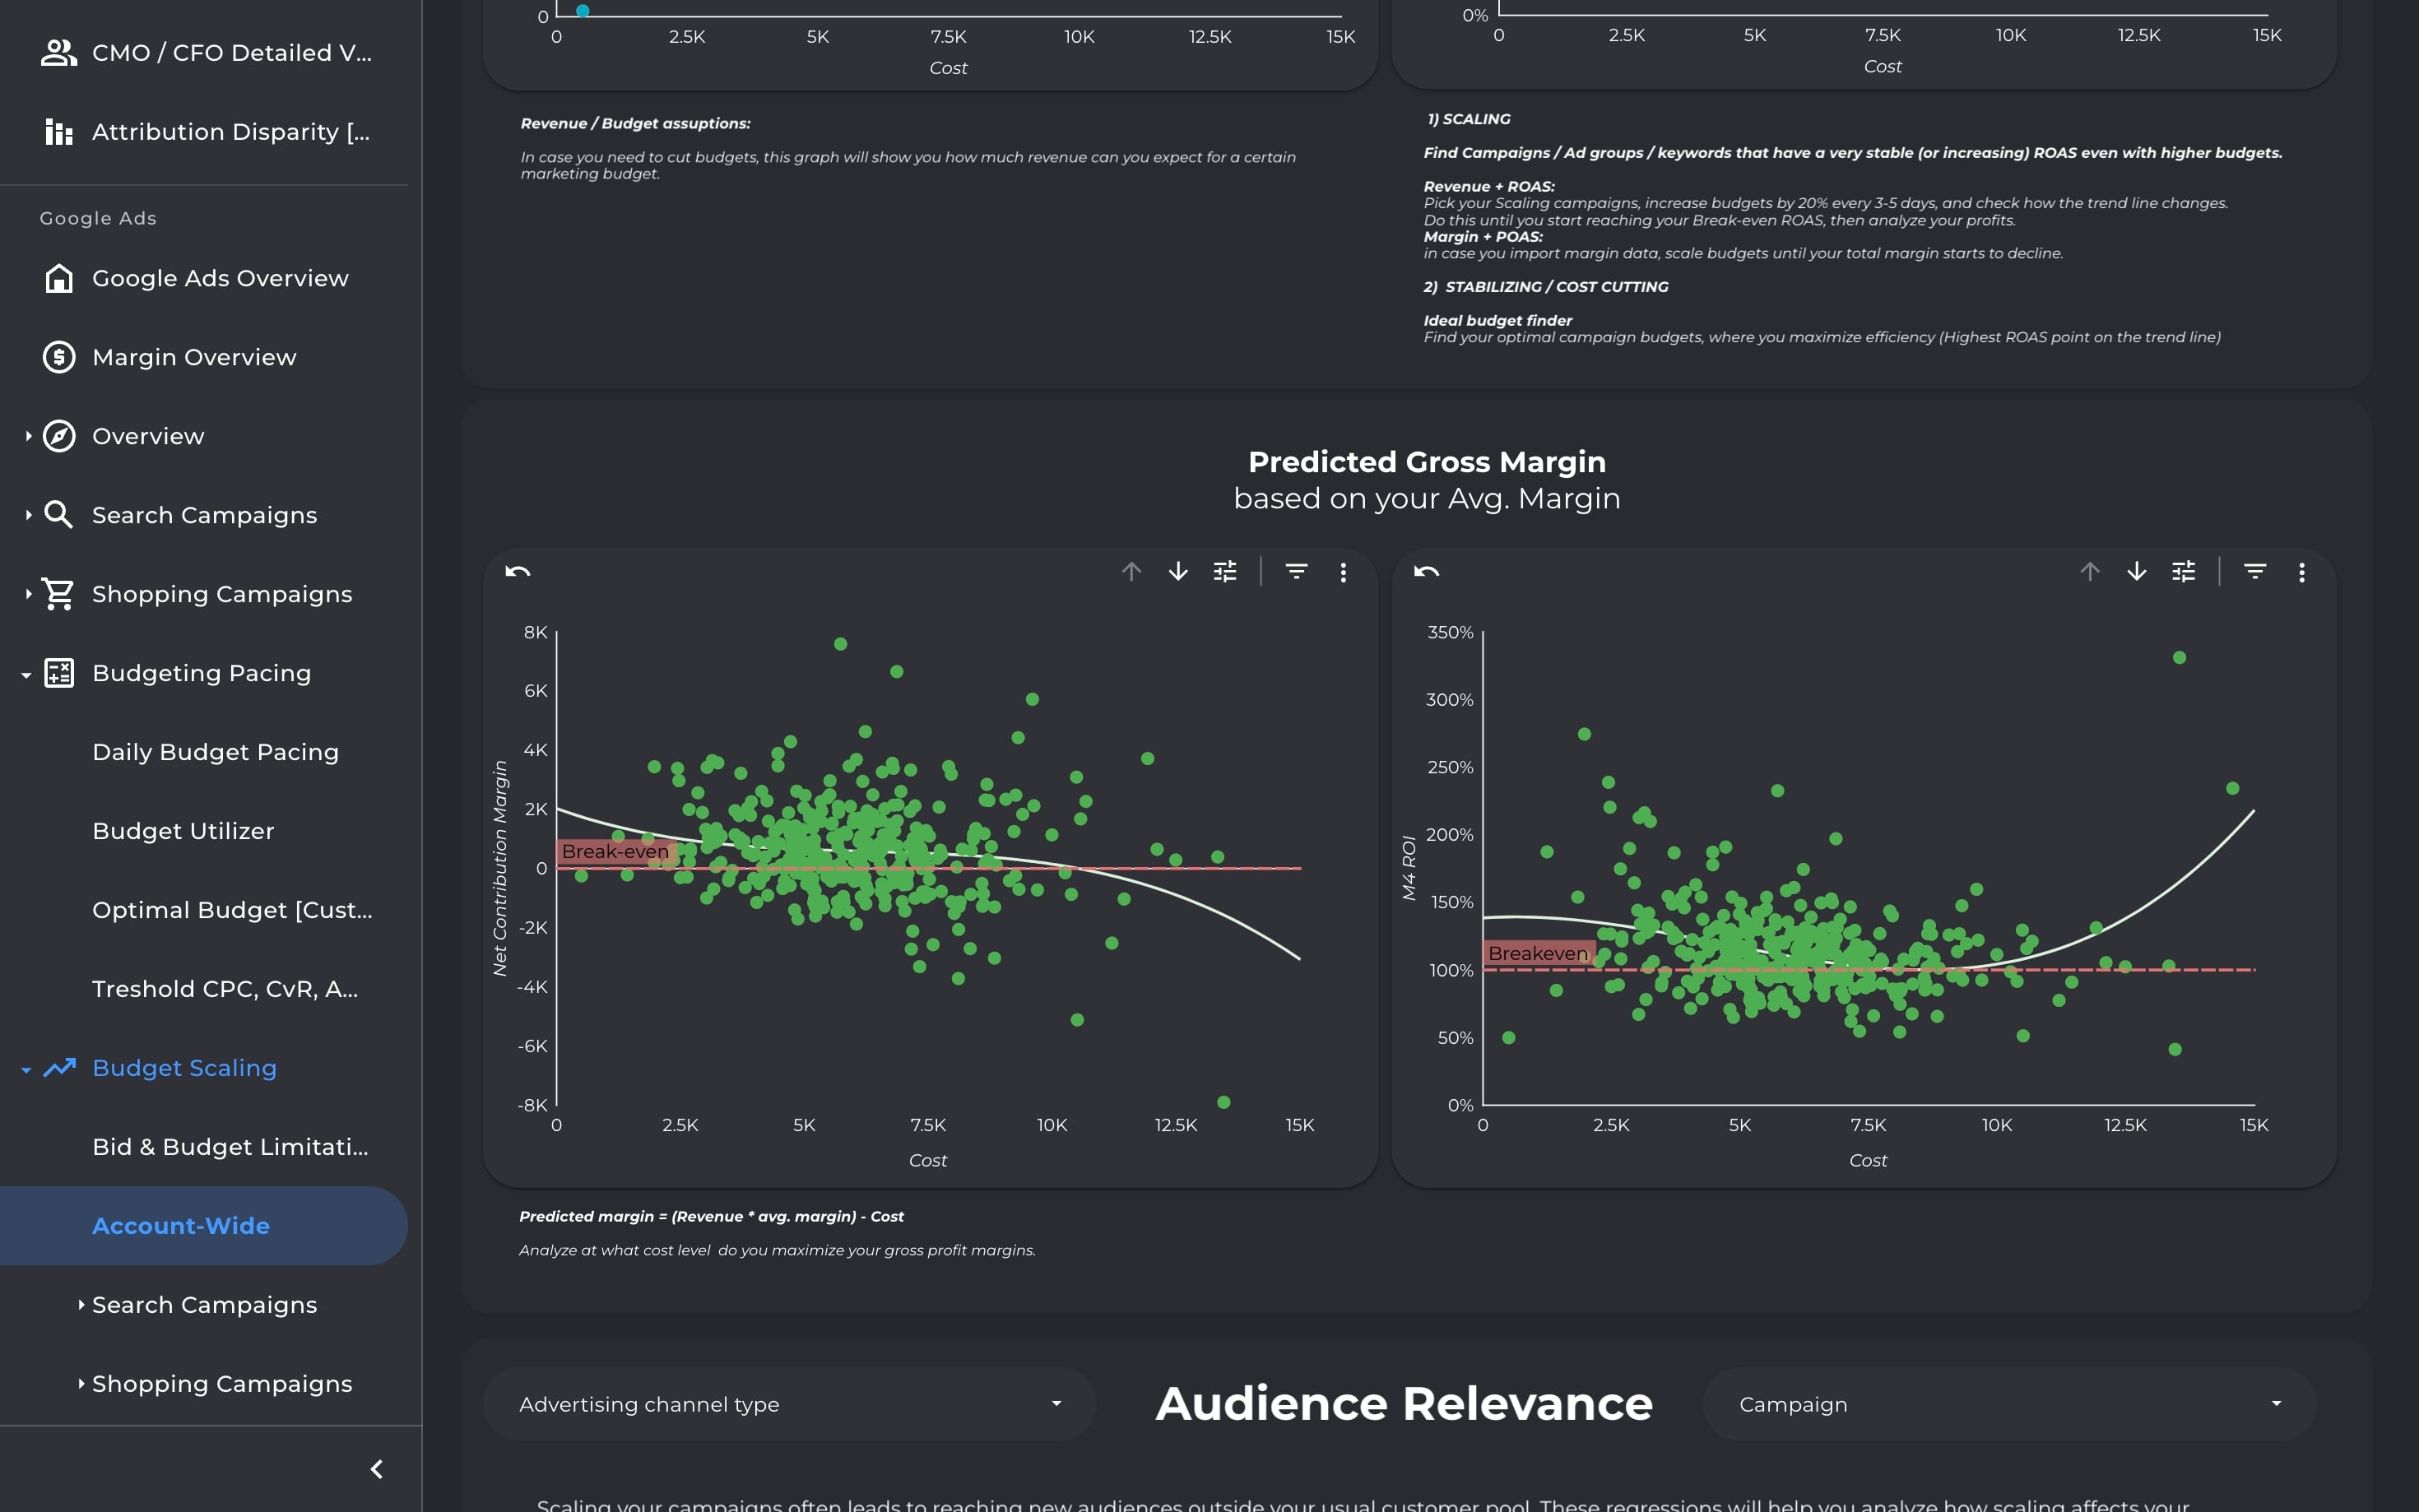
You'll also see instantly at what budget are you breaking even
* Contribution margin = 0)
* Profit over ad spend = 100%
4
If your data set is not perfect (which is totally normal), you can filter out extremes to get a better fitting regression & prediction
5
Let's proceed to the next steps now.
6
Secondly, you can see how is your campaign targeting changing with increased budget.
Some of the questions you can find answer for -->
7
Am I targeting the correct people?
* By how much less are people clicking my ads with higher spend (broader targeting)?
* Is the traffic converting less with higher spend (by how much)?
8
If i pay more for a click, am I also taking up more ad-space in the auction?
9
There are plenty of scaling insights hidden in Google Impression Share Metrics.
Using these can directly tell you, where Google thinks your Lost Potential to Scale hides.
Lets take a deep dive
10
Thanks to Lost Impression share metrics, we can estimate:
* How much potential Revenue (Conversion value)
* How many Orders (Conversions)
did we lose because of Budget, or Bid Limitations
11
This report goes deeper and also calculates, How much could you potentially Spend and Earn via Google Ads
12
The Incremental Net Contribution Margin is then calculated from the potentially lost Revenue & Investment
13
We have to keep in mind, that with higher investments, our efficiency naturally tends to decline.
14
That's why you can estimate CPM and Conversion rate based on 12-month avg. historic data
15
Now continue through the next steps
16
With CPM estimations, our Investment Headroom changes
17
With Conversion Rate Estimates, we are able to influence the "Est. Icremental ROAS" (efficiency)
18
Proceed to the following steps now.
19
Thanks to our estimates, we get a more precise estimation of our Google Ads campaign Contribution Margin Potential.
20
This report also shows the Gross Profit Potential in Time.
Thus you can see lost potential during peak seasons like Black Friday.
21
You can analyze way more metrics including:
* Headroom Investment
* Lost Headroom Gross Profit
* Lost Revenue
* Lost Conversions...
22
For example, let's add "Investment Headroom (Lost Spend)" into the chart
23
We can also go more glanular and analyze a specific campaign.
Simply click & select a certain campaign
24
The time series graph dynamically adjusts based on our selected campaign.
25
The final section takes a closer look how your campaigns were held back by budget or bids over time
26
The Bid & Budget Limits are reported for both the campaign and search keyword level
27
The Red Columns are for bid (tROAS) limitations